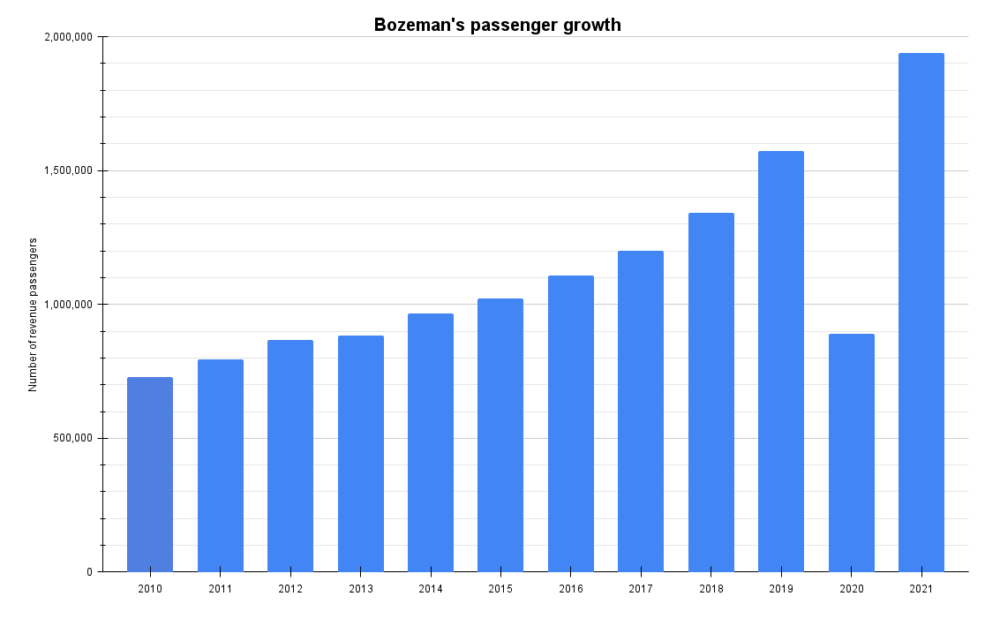
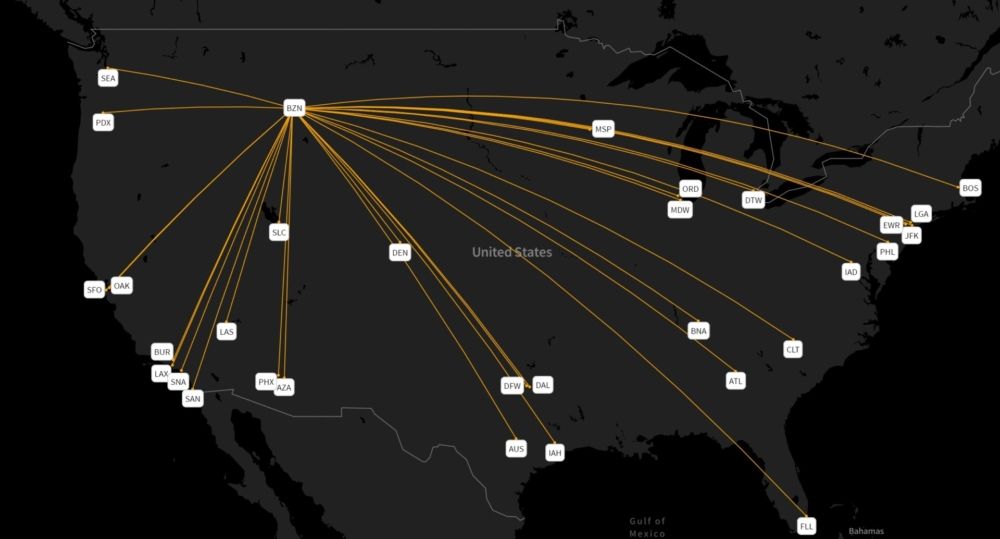
Bozeman ended 2021 with almost two million passengers, its highest to date. Encouraged by increased leisure demand for outdoor activity, new airlines flocked to the airport, nearly doubling its destination list. However, seats for sale rose significantly faster than demand, resulting in unsustainably low seat load factors.
The best year ever for Bozeman
Bozeman handled over 1.9 million passengers last year, its peak so far. The airport, a gateway to the world-famous Yellowstone National Park and huge outdoor activity, saw traffic increase by a quarter (23.3%) versus 2019, strongly beating its previous record.
Bozeman was tantalizingly close to welcoming two million passengers. Will it be beaten this year? It is possible but uncertain. According to OAG data, 2.04 million seats are for sale in the first nine months of 2022, 5% fewer than the same period last year. Bozeman will absolutely pass two million passengers soon, possibly in 2022 or 2023.
Stay aware: Sign up for my weekly new routes newsletter.
Why the growth?
The popularity of Bozeman is because of a renewed excitement in outdoor locations for leisure trips, with the domestic leisure element of demand holding up well during the pandemic. People couldn't necessarily travel where they ordinarily would, so they rethought opportunities.
This demand environment spurred new airline entrants. Building on Sun Country's entrance in 2020, Southwest, Allegiant, and Avelo added Bozeman last year. Southwest first served the Montana airport in May, one of many new airports to join the carrier's network last year.
|
Airline (including any regionals) |
Bozeman's 2019 passengers |
Bozeman's 2021 passengers |
% change |
|---|
But, seat load factors suffered
Despite the renewed interest, added capacity rose significantly faster than demand. While passenger volume increased by 23.3%, seats for sale were up by well over double (+54.8%). This resulted in below-par seat load factors (about 66% for 2021, down from 83%). Naturally, it was mainly the new entrants and those that added more capacity that suffered the most.
It tended to result in lower fares too, reflecting more non-stops, more ULCCs/LCCs, and higher competition. Airlines were a bit too optimistic, which is understandable under the circumstances.
Still, many markets grew very strongly
It might seem boring, but it's essential to look at how passengers (traffic) and fares change together. If passenger volume increased by 20% but fares fell by 25%, the airport-pair's total revenue declined. You want to see passenger growth far outstripping the reduction in fares. This is much more commonplace in leisure markets – like Bozeman.
In the third quarter of 2021, covering the July-September period, the DOT's Consumer Airfare Report shows that multiple markets saw this happen. Of course, it's often, but not always, due to a combination of new non-stop service or higher capacity (so more convenience and usability) and lower fares. Passenger volume on Atlanta-Bozeman rose by 60% from a 21% fall in fare. Others include:
- Nashville: passenger growth of 157% as the fare fell by 42%
- Austin: +100, -28%
- San Diego: +83%, -25%
- Boston (metro): +55%, -21%
- Phoenix (metro): +49%, -17%
What do you make of Bozeman's growth? Let us know in the comments.


