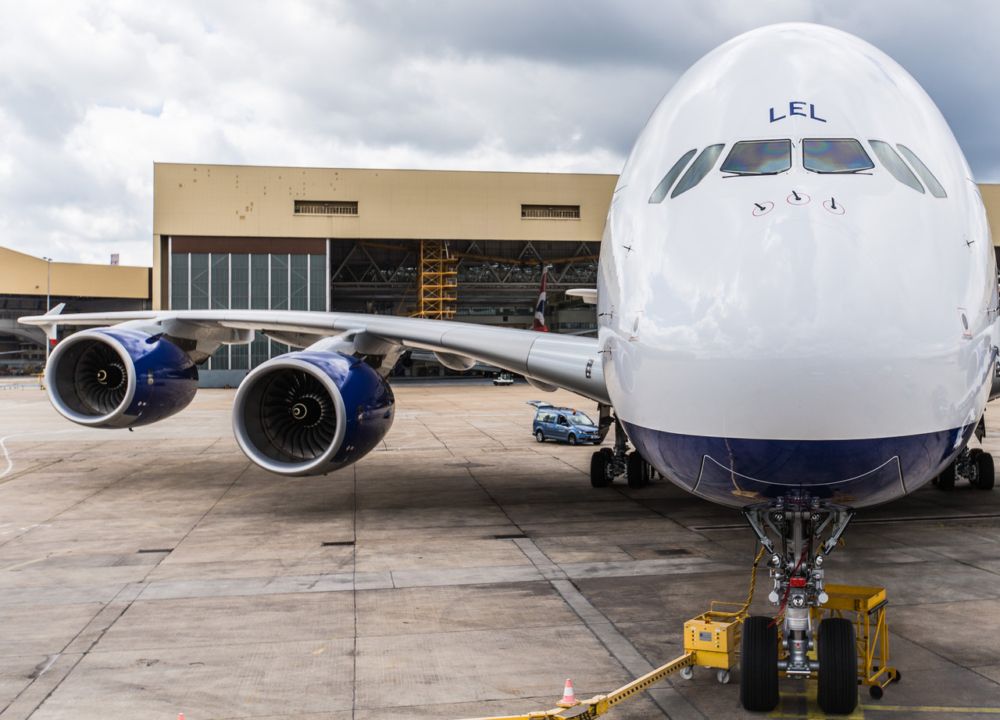
London Heathrow to Dubai is the world's number-one route in January if measured by available seat miles. Large aircraft, frequent service, distance, many seats per flight, and the pandemic have all played a part in the result. What other routes are in the top-10?
The world's top-10 routes in January 2022
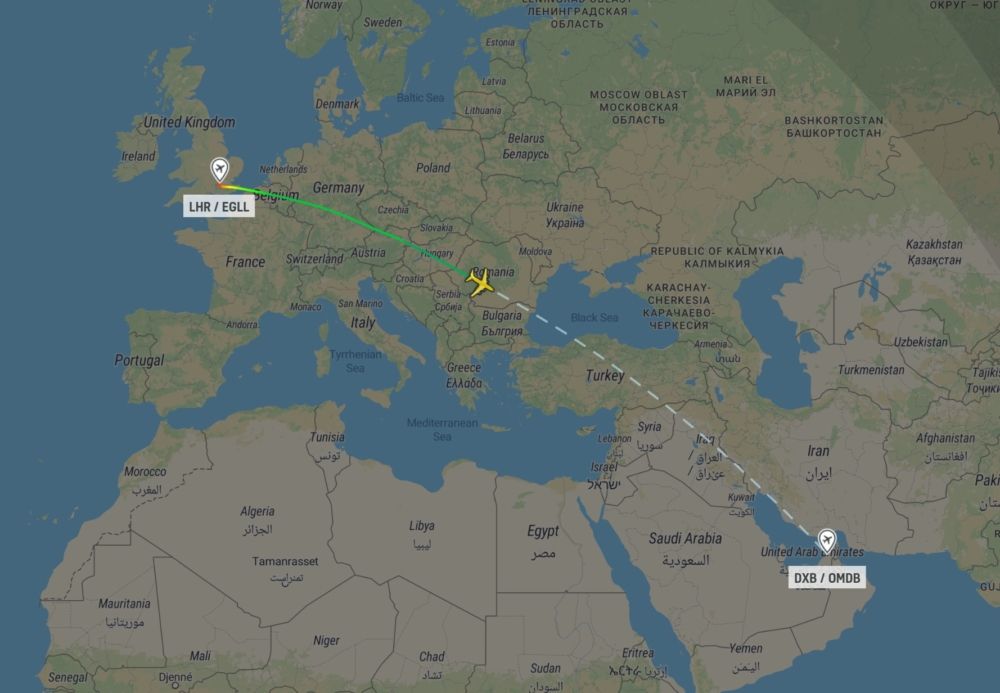
In a sign of the times, London Heathrow to Dubai is the currently world's number-one route (if we're being technical, it's a market). That's based on examining all routes globally using schedule information obtained from data experts Cirium. Considering available seat miles (ASMs; see below for an explanation), the world's top-10 routes this month are:
- Heathrow to Dubai: 811.9 million ASMs in January 2022
- Heathrow to New York JFK: 737.5 million
- JFK to Los Angeles: 653.9 million
- Paris Orly to Réunion (St. Denis): 577.0 million
- Honolulu to Los Angeles 555.3 million
- Okinawa to Tokyo Haneda: 520.9 milion
- Paris Orly to Pointe-à-Pitre: 519.7 million
- Los Angeles to Sydney: 515.2 million
- Heathrow to Los Angeles: 504.0 million
- Jakarta to Makassar: 491.1 million
Perhaps the most surprising is Los Angeles to Sydney. While ordinarily in the top-10, it hasn't been since the COVID struck because of Australia's virtually closed border. American, Delta, Qantas, and United will operate the long 7,488-mile (12,051km) route. Qantas will again use the A380, joining the B787-9 (American), A350-900 (Delta), and B777-300ER (United).
Why is Heathrow to Dubai the world's #1?
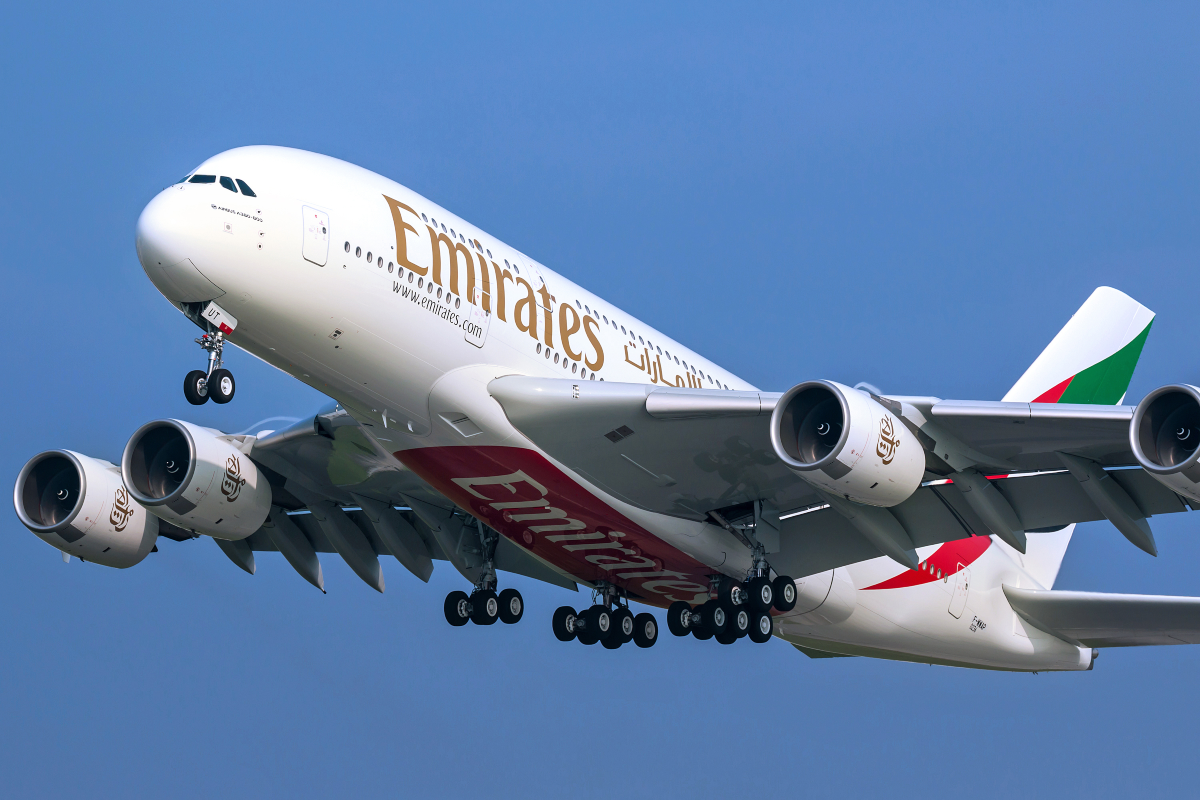
Dubai to Heathrow wouldn't be the leading route by ASMs without multiple factors. It has a relatively high frequency with either eight or nine daily departures. That wouldn't particularly matter if it used relatively low-capacity aircraft, but it doesn't. Cirium shows it has an average of 461 seats per departure, driven by 84% of flights utilizing the A380.
It is also helped by the distance of the route (3,421 miles, 5,505km). The pandemic has played a part too, temporarily reorganizing results. In January 2020, Heathrow-Dubai ranked seventh globally, while Heathrow to Singapore and Hong Kong were ahead. Ongoing restrictions, especially in Hong Kong, mean that neither route is currently in the top-10, pushing others up.
Stay aware: Sign up for my weekly new routes newsletter.
Heathrow to Dubai: up to nine daily flights
There are either eight or nine daily departures in January. On the 5th, the day of writing, there are nine, as shown below (all times are local). Six departures are by Emirates and three by British Airways. The A380 operates seven of the nine flights, including one of BA's.
- EK8: leaving Heathrow at 09:10 and arriving Dubai at 20:00; A380
- BA107: 12:25-23:35; A380
- EK2: 1340-00:40+1 the next day; A380
- EK30: 1550-02:40+1; A380
- EK32: 1900-05:50+1; A380
- BA109: 20:00-07:00+1; A350-1000
- EK4: 2020-07:20+1; A380
- BA105: 2040-07:45+1; A350-1000
- EK6: 2200-08:45+1; A380
Hang on – what are ASMs?
ASMs are a standard aviation industry measurement. They mean one seat flown one mile. For example, a 250-seat aircraft flying 1,000 miles would have 250,000 ASMs. If it had a once-daily round-trip across a whole year, it'd have 182.5 million ASMs (250,000 x two ways x 365 days). Aircraft size and distance disproportionately influence the results of this measure.
ASMs are one way of gauging airline output. What it sells of that output would be sold output, and it'd then enable the calculation of revenue per ASM, another routine measurement. Other measures, such as passenger revenue per ASM (PRASM) and total revenue per ASM (TRASM), could be calculated.
If the aircraft mentioned above could realistically operate three return trips per day, it has the capacity to produce 547.5 million ASMs annually. As such, the output of 182.5 million is three times lower than it could be and well below capacity. The aircraft isn't being fully utilized. Of course, whether it'd be economically sensible to grow the output of the aircraft depends on many factors, including the aircraft's age, fuel consumption, and ownership costs.
Other ways of looking at routes
ASMs are just one way to look at routes. Others include the number of passengers carried, number of seats for sale, number of flights, revenue passenger miles, total revenue, profitability, and more.
Some information is entirely or only partly available publicly or through a subscription service. Some data is known well ahead of time, enabling forward-looking analysis, while others appear publicly only two or more months after the fact – if at all. All have different benefits, are valid, and each provides further insights because they measure different things.
What about seats?
While a typical measurement, people sometimes dismiss them as they're simply offered for sale. They'll say that it's unimportant if 100,000 seats are supplied from O to D, as it’s unknown what quantity will be sold and that 'bums on seats' is all that matters. However, a forward-looking measure is obviously crucial, and what has been sold – and at what price – won't be available publicly until after the fact.
The number of seats for sale relative to demand may directly impact route economics, performance, and competitiveness. Too many seats and an airline will likely have to lower prices, which may increase seat load factor but reduce TRASM and overall route performance. If overcapacity persists, the route may need to be downgauged (meaning higher seat-mile costs) or reduced in frequency (subject to suitable alternatives and any slot or other scheduling restrictions), likely impacting market share and competitiveness.
In contrast, too few seats for sale will probably mean an airline is leaving revenue on the table. It'll raise the question of the ability, cost, and sense of adding more capacity versus doing something else with the available aircraft, just as American experienced when it decided to end Charlotte to Honolulu.
Have you flown any of the top-10 routes mentioned in the article? Share your experiences in the comments.

