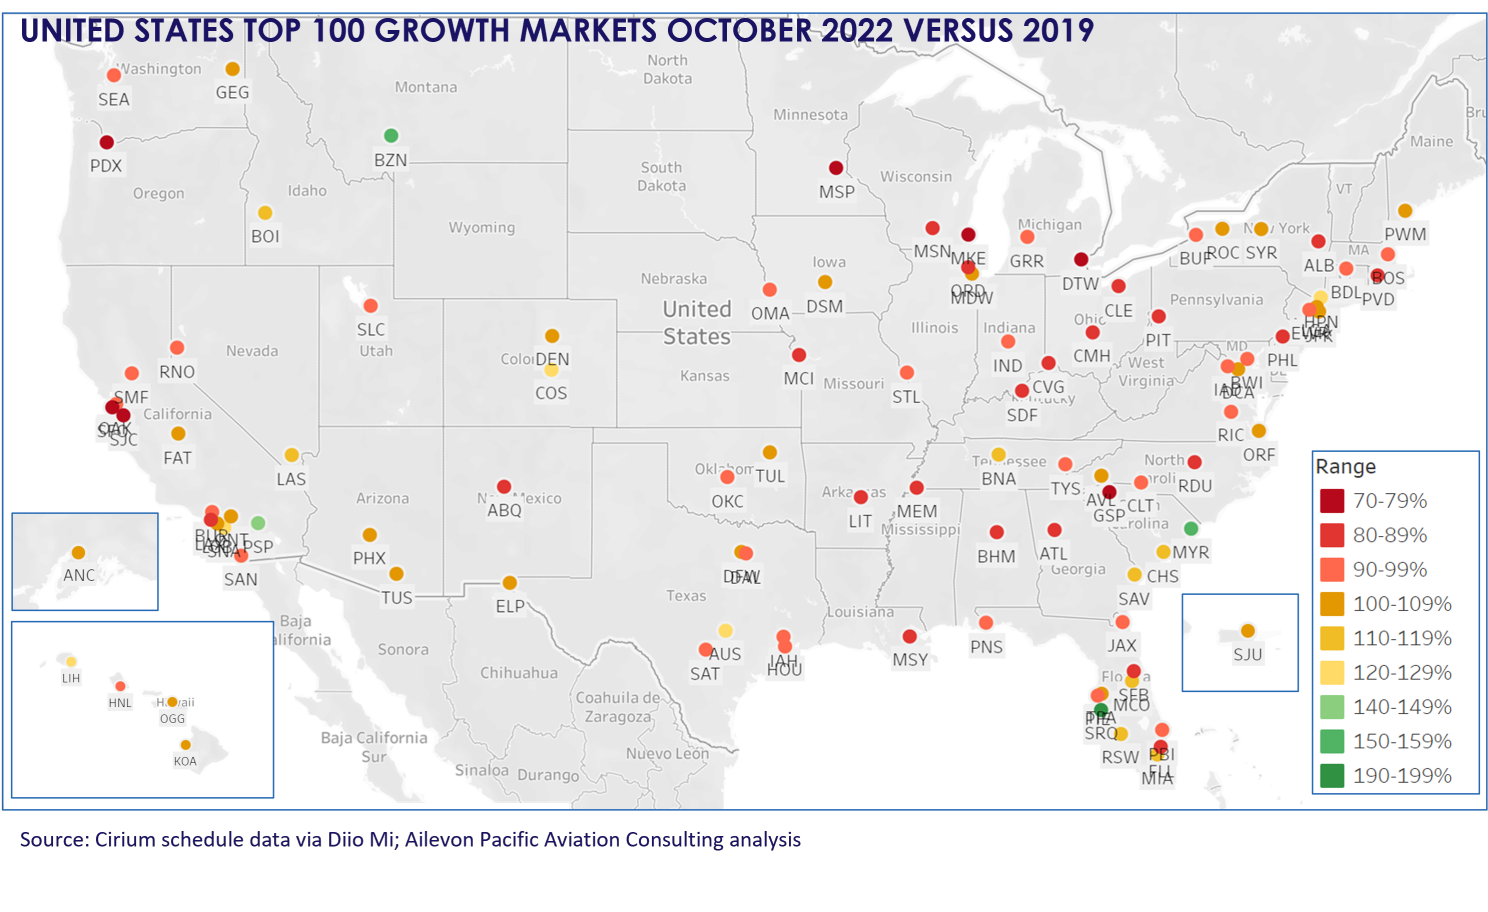
The USA's top 100 airports have 87.2 million departing seats planned for October, according to Ailevon Pacific Aviation Consulting, which uses Cirium data. While that might seem a lot, it's down by 10% from the 97.2 million planned five months ago.
It's not helped by the recovery of Delta, Hawaiian, Alaska, Southwest, and Allegiant slipping versus September. Most airlines adjusted capacity, temporarily reducing frequency or postponing routes and more, partly because of staff shortages. It reflects the current environment, and it's done to help increase the likelihood of being achieved and for reliability reasons.
The US this October
While the country's leading 100 airports have 87.2 million seats for sale this October, that's 94.9% of the 91.9 million available in October 2019. Ailevon Pacific shows that 40 US airports now have more capacity than pre-pandemic. Significantly, this includes a handful of big airports with more than two million departing seats:
- Miami (ranks 13th most recovered, with 115.71% of October 2019 seats)
- Las Vegas (15th; 113.28%)
- Orlando International (17th; 113.28%)
- Denver (27th; 105.10%)
- Phoenix (36th; 100.87%)
- Dallas Fort Worth (40th; 100.07%)
Obviously, 60 of the country's top 100 airports remain below the October 2019 level. This includes all the other major hubs. Atlanta, the world's busiest passenger airport, ranks 79th, with its recovery at just 88.02%. For a complete list of the 100 airports, click here.
Stay aware: Sign up for my weekly new routes newsletter.
The fastest growing airports
As you'd expect, the fastest growing airports still rely enormously on leisure demand. With a near doubling of capacity, Sarasota is firmly the country's most recovered airport in October. The Florida airport has benefited from the arrival of Avelo, Breeze, Southwest, and Sun Country, a doubling of capacity by Allegiant, and meaningful growth by American and United.
Notice the presence of Austin – by far the largest airport by recovery – and how Westchester (mainly due to Breeze), Lihue (from Southwest), and Orange County feature. In the case of Orange County, Air Canada, Allegiant, and Spirit have since joined, along with good growth by incumbents Southwest, Frontier, and American.
|
USA rank (of 100) |
Airport |
Oct. 2022 seats |
Oct. 2019 seats |
Recovery vs. 2019 |
|---|---|---|---|---|
|
1 |
Sarasota |
183,852 |
93,998 |
195.59% |
|
2 |
Bozeman |
87,403 |
61,268 |
158.98% |
|
3 |
Myrtle Beach |
220,440 |
142,000 |
155.24% |
|
4 |
Palm Springs |
152,961 |
105,982 |
144.33% |
|
5 |
Austin |
1,209,788 |
934,758 |
129.42% |
|
6 |
Colorado Springs |
121,470 |
94,567 |
128.45% |
|
7 |
Westchester |
115,659 |
92,252 |
125.37% |
|
8 |
Lihue |
196,398 |
160,815 |
122.13% |
|
9 |
Orange County |
629,975 |
516,861 |
121.88% |
|
10 |
Boise |
259,710 |
219,751 |
118.18% |
Discover more aviation news.
The slowest recovering airports
The airports in the table below have 10.7 million seats planned, down from 13.8 million in 2019. Detroit is the country's slowest airport to recover, of the 100 examined, with not even three-quarters of the capacity it once had.
It is, of course, mainly due to the sluggish recovery by Delta, with Detroit still a fortress hub for the SkyTeam member. Delta's slow recovery meant that capacity growth by other operators – Air Canada, Air France, Alaska, Frontier, JetBlue – was clearly insufficient to offset the behemoth. Detroit is Delta's third-busiest hub behind Atlanta and Minneapolis, whether analyzed by seats or flights.
|
USA rank (of 100) |
Airport |
Oct. 2022 seats |
Oct. 2019 seats |
Recovery vs. 2019 |
|---|---|---|---|---|
|
91 |
Orlando Sanford |
124,098 |
151,650 |
81.83% |
|
92 |
Los Angeles |
3,420,829 |
4,267,600 |
80.16% |
|
93 |
Madison |
99,746 |
125,001 |
79.80% |
|
94 |
San Francisco |
2,296,070 |
2,898,188 |
79.22% |
|
95 |
Greenville-Spartanburg |
115,524 |
146,733 |
78.73% |
|
96 |
San Jose |
706,622 |
910,728 |
77.81% |
|
97 |
Minneapolis |
1,520,974 |
1,973,396 |
77.07% |
|
98 |
Milwaukee |
274,829 |
361,849 |
75.95% |
|
99 |
Portland (Oregon) |
759,908 |
1,007,795 |
75.40% |
|
100 |
Detroit |
1,424,096 |
1,913,256 |
74.43% |
What do you make of it all? Let us know in the comments.
Source: Ailevon Pacific.

-N188DN-(2).jpg)

